Index of Multiple Deprivation (IMD)
The English Indices of Deprivation (ID) are a useful tool for targeting services to help tackle deprivation. They provide a means of identifying the most and least deprived areas (LSOAs) in England and to compare whether one area is more deprived than another.[1] The ID2019 was published in September 2019, to replace the previous ID2015.
The Index of Multiple Deprivation (IMD) is a measure of relative deprivation for small areas (Lower Super Output Areas (LSOAs). It is a combined measure of deprivation based on a total of 37 separate indicators that have been grouped into seven domains, each of which reflects a different aspect of deprivation experienced by individuals living in an area.

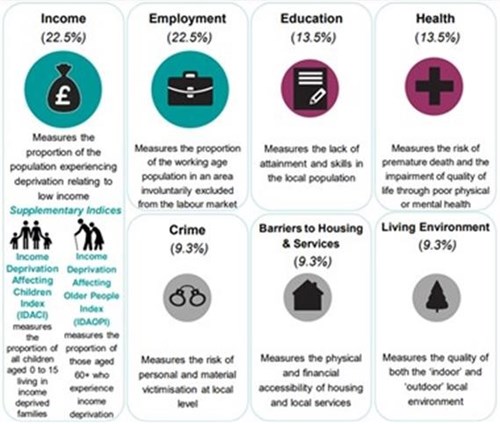
Source: Ministry of Housing, Communities and Local Government, 2019
Every LSOA in England is given a score for each of the domains and a combined score for the overall index. This score is used to rank all the LSOAs in England from the most deprived to the least deprived, allowing users to identify how deprived areas are relative to others.
For the purposes of identifying the most and least deprived areas, the list of LSOAs in England (or Herefordshire) is placed in order and divided into equal parts called percentiles. An LSOA is in the 25% most deprived nationally if it falls within the most deprived quarter of all areas in England. The most deprived areas are described as being in the 'top 10%' - note that these areas will also be in the 25% most deprived.
The Office for National Statistics (ONS) have released several supporting documents to accompany the Indices, including details of the underlying methodology, how to use the indices and the main findings for England. These can be found on The Ministry of Housing, Communities and Local Government website The Ministry of Housing, Communities and Local Government.
In addition, a Guidance Note and Frequently Asked Questions document can also be downloaded from the resource box.
Multiple deprivation in the national context[2]
Figure 1: Maps showing the areas of Herefordshire that are among the most deprived nationally according to the Index of Multiple deprivation 2019.
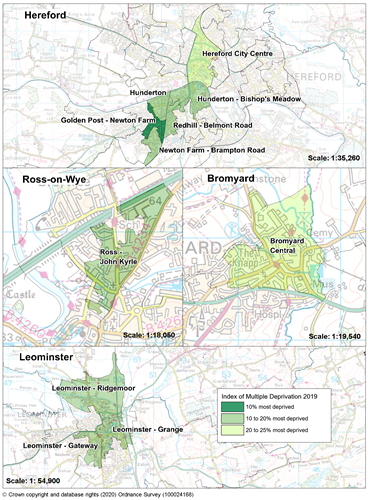
Source: Ministry of Housing, Communities and Local Government.
Deprivation at county level
The Indices of Deprivation are designed to measure the relative deprivation of LSOAs. There is no single summary measure of deprivation for larger areas, such as local authorities, because levels of deprivation and population density can vary considerably across them. However, the Ministry of Housing, Communities and Local Government has published several measures that highlight different aspects of deprivation, each generating a different ranking of areas. Comparison of the different measures is therefore needed to give a fuller description of deprivation for larger areas.
Out of 317 local authority districts in England, Herefordshire ranks between 137 and 152 depending on whether the ranking is derived by averaging the domain score or rank or by local population concentration or extent of deprivation, with one being the most deprived. See section 3.3 of the MHCLG’s Research Report for further details of the different measures used.
Based on rank of average score, which is the most commonly used measure, Herefordshire is in the seventh most deprived decile of upper tier (county or shire council) authorities, being ranked 97th most deprived out of all a total of 151 such bodies; Herefordshire is more deprived than its geographical neighbours – Shropshire (ranked 110), Worcestershire (ranked 105) and Gloucestershire (ranked 124).
[1]Lower Super Output Areas (LSOAs) are fixed statistical geographies of about 1,500 people designed by the Office for National Statistics (ONS).
[2]National context means how a particular area compares in terms of deprivation relative to all LSOAs in England i.e. the national rank.