Useful definitions
Confidence intervals
When making estimates about a whole population based on a sample of that population, there is a margin of error around those estimates. Confidence Intervals (C.I.) are used to give an indication of the likely size of this margin. The smaller the sample size and the greater the degree of variation, the wider the C.I. will be.
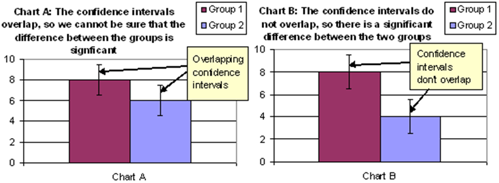
Confidence intervals are used as a clear and simple method of determining whether the difference between two groups is “statistically significant”, i.e. whether there is sufficient evidence to suggest that it reflects a real difference in the wider population. If the confidence intervals of the two comparative sets of data overlap, then the difference is not statistically significant (e.g. Chart A, below). If the confidence intervals do not overlap, then the difference is statistically significant (e.g. Chart B, below).
Depending on the situation, Confidence Intervals may be explicit as in the charts above, or simply be reflected in the commentary, i.e. differences may be highlighted if they are statistically significant and apparent differences not mentioned if they are not statistically significant.
Medians and quartiles
The median for a dataset is the value such that 50% of the data points are lower and 50% of the data points are higher when all data points are arranged in order of size. It is an overall summary measure that is less affected by the presence of extreme values (outliers) than the mean (which is another type of average summary measure calculated by summing all the data points and dividing by the number of them).

Further explanation of the use of the median and the mean can be found in the resource box.
The lower quartile for a dataset is the value such that 25% of the data is lower and 75% of the data is higher. The upper quartile for a dataset is the value such that 75% of the data is lower and 25% of the data is higher. The term "quartile" is also used to refer to a range bounded by the quartile values. For example, saying that a score lies "in the upper quartile" really means it lies in a range bounded by the upper quartile value and the highest score achieved. Saying it lies "in the second quartile" really means it lies in a range bounded by the median and the upper quartile value. The "inter-quartile range" is the range of values bounded by the upper and lower quartiles.
Quartiles and medians have been used for two specific purposes:
To compare earnings in Herefordshire with those elsewhere at three different points on the earnings distribution e.g. low earners (25% lower quartile), average earners (median) and high earners (25% upper decile).
To compare performance in Herefordshire with all English Authorities. Here the terms top quartile and bottom quartile have been used.
If high values of a performance indicator are desired:
the top quartile of authorities equates to the upper quartile of the dataset
the bottom quartile of authorities equates to the lower quartile of the dataset.If low values of a performance indicator are desired:
the top quartile of authorities equates to the lower quartile of the dataset
the bottom of authorities quartile equates to the upper quartile of the dataset.In some cases, the terms "best" and "worst" are used in preference to "upper / lower" or "top / bottom", to avoid confusion.
Understanding sub-county geographies
There are two key things to remember about statistics for areas smaller than counties:
1. the difference between statistical geographies and administrative geographies, and
2. how different areas ‘nest’ into each other (the geographical hierarchy)
Administrative geographies
Geographies that are used for administrative purposes are not always ideal for publishing statistics: they can vary substantially in population size meaning that comparisons aren’t really appropriate (e.g. wards), or can even be so small that publishing statistics could risk identifying an individual (e.g. parishes). They can also change significantly over time.
Despite these disadvantages, administrative geographies are often well-known and meaningful to people, and statistics are needed for people and organisations to understand the characteristics of their areas. Commonly used administrative geographies in Herefordshire are parishes, wards and localities. Statistics can also be produced for Hereford city and the five market towns.
Another complexity of administrative geographies is their hierarchy. Civil parishes are generally the smallest building block in rural areas and these ‘nest’ into group parishes (in some cases) and then wards. However, in larger urban areas (Hereford, Leominster and Ross) wards can be smaller than parishes, and they don’t always nest perfectly. Localities are built from group parishes, and contain more than one ward – but some wards cross locality boundaries.
Statistical geographies
In 2004, the Office for National Statistics (ONS) designed a standard set of statistical geographies to avoid the problems associated with administrative geographies. Using the results of the 2001 Census, they were designed to have similar population sizes and, to a certain extent, similar characteristics. They also ‘nest’ into a clear hierarchy: output areas (OAs) have around 300 people, on average, that group together to form lower super output areas (LSOAs) of 1,600 people on average, which in turn group to form middle super output areas (MSOAs) of 8,000 people on average. MSOAs do not cross county boundaries.
More detail about the statistical geographies can be found on the Office for National Statistics' Census geography page.
One of the main principles for the statistical geography hierarchy is stability over time, meaning that the results of the 2001, 2011 and 2021 Censuses were based on the same statistical geographies. Some changes (less than 3% of OAs in Herefordshire) occurred for release of the 2021 Census data, that involved either the merging or splitting of the existing OAs to ensure that population and household thresholds were met -18 of Herefordshire’s 640 2011 OAs have been split into two or more 2021 OAs and 8 have been merged with another one or more. The only LSOA change is the dividing of the ‘Holmer, Pipe & Lyde’ LSOA into two - a rural and an urban component.
Statistical Neighbours or Herefordshire Comparators
There are various comparison groups available for different purposes of local authority benchmarking process.
Benchmarking is the process of comparing a local authority’s performance, outcomes, or characteristics with those of other councils to provide context for decision-making. It helps identify areas of strength and improvement, understand whether local trends are unique or widespread, and support evidence-based planning and service delivery. Benchmarking enables councils to set realistic targets, share best practice, and monitor performance more effectively.
Rather than comparing with all local authorities, benchmarking is often undertaken using comparators—groups of councils with similar demographic, socio-economic, and geographic characteristics. Using comparator authorities provides a fairer and more meaningful assessment of performance by accounting for differences in local circumstances. For Herefordshire, a largely rural county, comparator groups help ensure that comparisons reflect similar service delivery challenges. The most commonly used group is the CIPFA (Chartered Institute of Public Finance and Accountancy) nearest neighbours used by LG Inform (data benchmarking).
There are two other main comparator groups used by Children services and Health and Social Care services, The Government LAIT Tool defined neighbours and NHS England nearest statistical neighbours respectively.
As at July 2025, the CIPFA nearest neighbours to Herefordshire are:
1. Bath and North East Somerset
2. Cheshire East
3. Cheshire West and Chester
4. Dorset
5. East Riding of Yorkshire
6. Isle of Wight
7. North Lincolnshire
8. North Somerset
9. Northumberland
10. Rutland
11. Shropshire
12. Warrington
13. West Berkshire
14. Westmorland and Furness
15. Wiltshire
The relationship between administrative and statistical geographies in Herefordshire
Following changes that were made to ward boundaries in 2015, they no longer align to OAs and LSOAs. This means that statistics provided for administrative geographies will need to be ‘best-fitted’ from statistical geographies.
Rural urban classifications
Rural and urban classifications are the product of a project commissioned jointly by the Office for National Statistics (ONS), the Department for Environment, Food and Rural Affairs (Defra), the Office of the Deputy Prime Minister (ODPM), the Countryside Agency (CA) and the Welsh Assembly Government to create a new settlement-based definition of urban and rural areas.
In 2004, classifications were published for all output areas, lower super output areas (LSOAs) and wards in England & Wales by settlement form and sparsity. The categories used are:
Urban
Rural
Rural town (town and fringe)
Rural village
Rural dispersed (hamlets and isolated dwellings)
Each of these categories is then divided into "sparse" and "less sparse". Settlements of 10,000 people or more are considered urban. Hereford, Leominster and Ross-on-Wye fall into this category. The remaining market towns (Kington, Bromyard and Ledbury) are classified as "rural towns".
Following the initial classification of output areas, a classification of local authority areas was initiated by Defra. This classified local authorities as either major urban, large urban, other urban, significant rural, rural-50 or rural-80. Herefordshire is classified as rural-50; between 50% and 80% of the local authority's population live in a rural settlement.
The rural nature of Herefordshire can be seen in the map below. You may notice a rogue urban area just north-east of Ledbury - it seems likely that when classifications were made, the Malvern Hills were not taken into account, so villages in the Colwall area may have been seen as suburbs of Malvern.
Map 1. Rurality of Herefordshire at Output Area level
