What people die of
Main Points
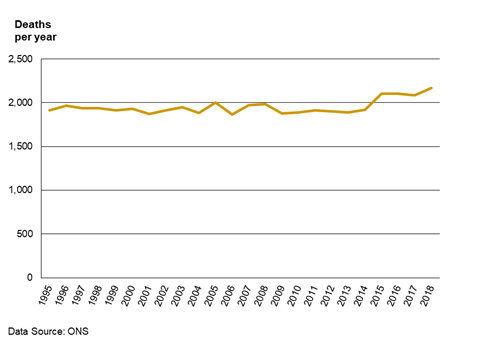
- In 2018 there were 2,169 registered deaths of Herefordshire residents which is the highest figure recorded since the turn of the century.
- Both male and female mortality rates in Herefordshire have shown a downward trend since 1995 and remain lower than the corresponding national figures.
- Cancer, diseases of the circulatory system and diseases of the respiratory system are the most common underlying causes of death in Herefordshire.
- Male and female premature mortality rates have fallen since the turn of the century and have both been consistently lower than the corresponding national rates.
- The most common underlying causes of premature deaths in Herefordshire are cancer and diseases of the circulatory system.
- Across Herefordshire the premature mortality rate is higher in the most deprived areas of the county compared to less deprived areas.
- The Herefordshire infant mortality rate continues to fluctuate, although not significantly.
Highest annual number of deaths registered in 21st Century
The number of deaths recorded annually in Herefordshire remained relatively consistent between 1995 and 2013, although in subsequent years numbers increased - Figure 1. In 2018 there were 2,169 recorded deaths which is the highest annual number of death registrations in the county since the turn of the century.
It is anticipated that, as the population in Herefordshire is increasing in both size and age, the number of deaths recorded annually will continue to increase in the future.
Figure 1: Number of recorded deaths.
Males represent a higher proportion of deaths under the age of 85 years compared to females, while females account for the greater proportion of deaths in older age groups. This reflects the higher life expectancy in females which in 2015-17 was 83.6 years compared to 79.8 years for males.
Age-standardised mortality rates fall
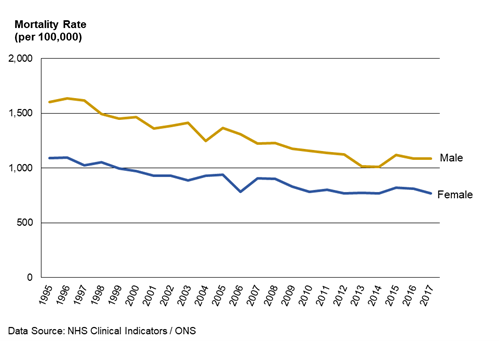
In 2017 the male mortality rate of 1,085 per 100,000 was 26% lower than that recorded in 2000. Similarly, the female rate of 771 per 100,000 represented a 21% decrease on 2000 - Figure 2. Throughout this period both rates have been lower than those reported for England as a whole.
Figure 2: Mortality rates by gender.
Two out of three deaths are related to cancer or diseases of the circulatory system
In 2017 the most common underlying causes of mortality in Herefordshire were cancer (605 deaths – 29.0%) and diseases of the circulatory system (589 deaths – 28.2%). Other causes of note were diseases of the respiratory system (274 deaths – 13.1%) and mental and behavioural disorders (193 deaths – 9.3%). The local proportions are similar to those recorded nationally.
Mortality rates for cancer and respiratory disease fall while that for mental and behavioural disorders rises
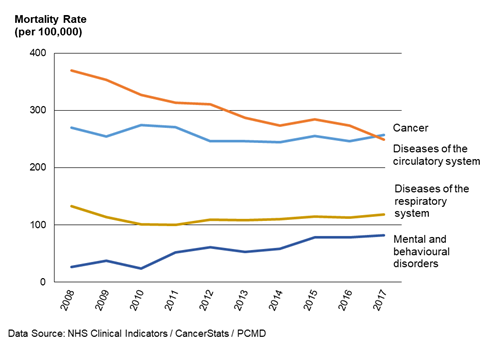
Mortality rates for both cancer and diseases of the circulatory system have shown fairly steady decreases over the last decade, while the rate for diseases of the respiratory system has shown little change - Figure 3.
Conversely, over this period the mortality rate for mental and behavioural disorders (e.g. dementia) has increased steadily with the 2017 figure (81.9 per 100,000) being three times higher than that recorded in 2008 (26.7 per 100,000). This increase is likely to be due to improvements in recognition, identification and diagnosis of these conditions.
These patterns are similar to those observed across England as a whole.
Figure 3: Age standardised mortality rates for most commonly recorded broad causes of death.
Premature mortality rates fall but premature death is more prevalent in most deprived areas
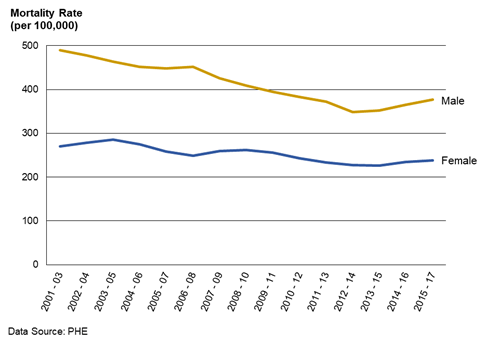
The premature mortality rates (i.e. for deaths occurring under the age of 75) for both males and females have shown a general fall since the turn of the century (Figure 4) and continue to be lower than the corresponding national figures. In 2015-17 the male rate was 376 per 100,000 while the female figure was 239 per 100,000 with the most common underlying causes being cancer (44%) and diseases of the circulatory system (25%).
Across Herefordshire an individual is 1.3 times as more likely to die prematurely in the most deprived areas of Herefordshire compared with the least deprived.
Figure 4: Premature mortality rates by gender.
Infant deaths continue to vary, although not significantly
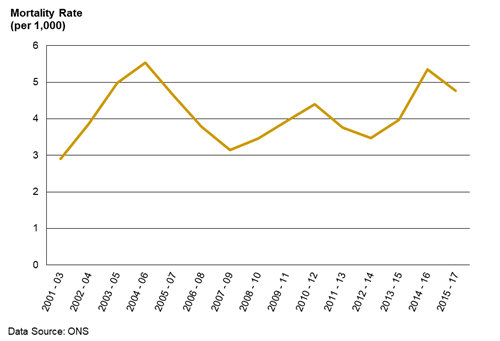
Since 2001-03 the number of infant deaths (i.e. occurring in those under one year) in Herefordshire has varied with the crude infant mortality rate fluctuating accordingly – Figure 5. The rate for 2015-17 of 4.8 per 1,000 is the fourth highest recorded over this period but it is not statistically different from any of the figures previously recorded this century. Throughout this period the local rate has been similar to that reported for England.
Figure 5: Crude infant mortality rate.
