Workforce
Employment by sector and industry
The information in this section comes from the Office for National Statistics (ONS) Business Register and Employment Survey (BRES), which is the official source of employee and employment estimates by detailed geography and industry (1).
Key points:
- In Herefordshire, there were an estimated total of 80,700 employees in 2021, up 3% from 2020 (78,300) and up 2% from 2015 (78,800). There were 88,950 employments in 2021, up slightly from 88,050 in 2020.
Figure 1: Number of employees (full and part-time) and employments in Herefordshire 2015-2021
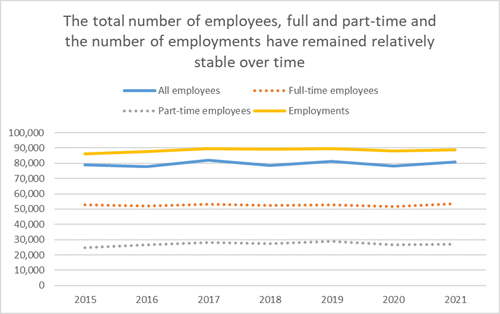
Data source: ONS - Business Register and Employment Survey 2021
- In Herefordshire, around two thirds of employees (65%) work full time.
- The industries employ the largest numbers of people are ‘health’ (12,000), ‘manufacturing’ (11,000) and ‘retail' (9,000) (see Figure 2). Around 40% of employees in the county fall into these categories and the proportions working in each of these industries is higher than nationally and regionally.
Figure 2: Number of employees full and part-time) by broad industry group (2021)
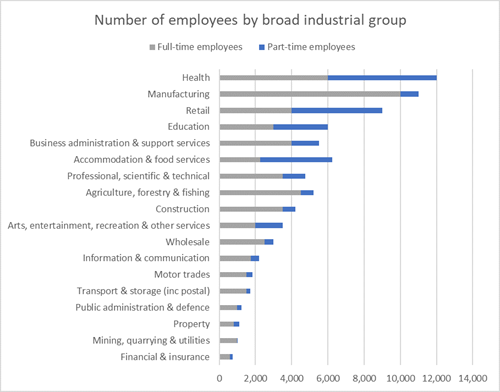
Data source: ONS - Business Register and Employment Survey 2021
- 'Agriculture, forestry & fishing' accounts for 5,000 employees but around 11,000 employments (reflecting the higher number of working owners in the sector) - see Figure 3. In terms of both employees and employments the proportion employed in this sector (6.2% of employees and 12.2% of employments) is much higher than nationally (0.6% and 1.3% respectively or regionally (0.9% and 1.9% respectively), which is to be expected given the rural nature of the county,
Figure 3: Number of employments by broad industry group (2021)
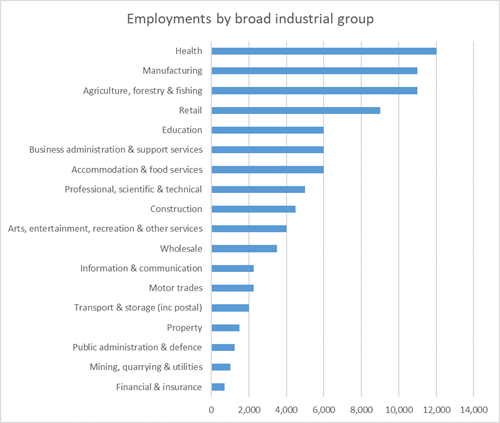
Data source: ONS - Business Register and Employment Survey 2021
- The proportion of employees employed in 'manufacturing' is also higher than nationally (13.6% compared to 7.5% nationally).
- In contrast, the proportions employed in ‘financial and insurance’, ‘professional, scientific and technical’, ‘transport & storage ‘ and ‘business administration & support services’ are lower than nationally.
- In 2021 15% of employees in Herefordshire worked in the public sector (BRES data): a slightly lower proportion than nationally and regionally (both 17%). 13% of employments were in the public sector, compared to 17% nationally and regionally.
Job density
Key points:
- Job density is a measure of labour demand in an area. It shows the supply of jobs relative to the size of the working-age population (16-64). A higher job density can be suggestive of a high proportion of people being employed locally, or (less likely in the case of Herefordshire) large numbers commuting into an area to work.
- In 2021 (the latest available year), job density in Herefordshire (0.98) was at its highest level since data became available in 2001 and was higher than in both the West Midlands region (0.81) and England (0.86). Job density in Herefordshire has shown as increasing trend since 2014.
Figure 4: Annual job density 2000 to 2021
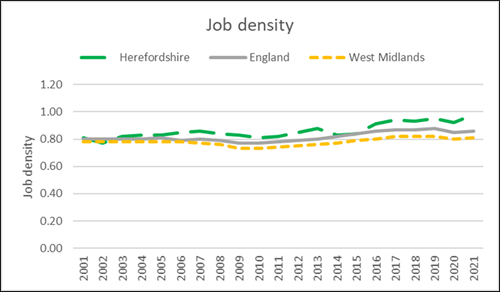
Data source: ONS
(1) The BRES survey collects employment information from UK businesses across each site that they operate. Due to the survey’s large sample size (approximately 85,000 businesses), BRES is able to produce good quality estimates for detailed breakdowns by industry and geography. The employment data in BRES represents the number of employees added to the number of working owners (for example, sole proprietors and partners). However, BRES does not cover very small businesses that are not VAT or Pay-As-You-Earn (PAYE) registered. These businesses account for only a small part of the overall economy, but it accounts for the difference between the BRES UK estimate of employment and the estimate from the ONS (Office for National Statistics) workforce jobs series. For total employment figures, other ONS sources such as workforce jobs (regional) and the Annual Population Survey (sub-regional) can provide fuller coverage of total employment, albeit with a less detailed industrial breakdown. The figures include businesses registered for PAYE but not for VAT, so are not continuous with BRES datasets for years prior to 2015. Also please noted that the current figures include farm agriculture which was excluded in previous years. The revised figures for 2016 and 2015 are included in this update.
(2) Job density is the number of jobs in an area relative to the size of the working age population (defined as all people aged 16-64) and is a measure of availability of employment for residents of an area. The total number of jobs is a workplace measure derived from a number of sources including employees (from the Business Register and Employment Survey), numbers of self-employed (from the Annual Population Survey), government-supported trainees (from DfES and DWP), and HM Forces personnel (from MoD).