Industry and business
The most detailed counts of business come from the 'UK business counts' data set, which is based on an extract compiled from the Inter Departmental Business Register (IDBR). Businesses are either counted at an enterprise or local unit level:
- An enterprise can be thought of as the overall business, made up of all the individual sites or workplaces. It is defined as the smallest combination of legal units (generally based on VAT and/or PAYE records) that has a certain degree of autonomy within an enterprise group.
- A local unit is an individual site (for example a factory or shop) associated with an enterprise. It can also be referred to as a workplace. Most businesses will only be counted once as an enterprise and once as a local unit i.e. they operate from a single site.
According to published data:
- In 2022 there were 10,620 enterprises in Herefordshire. Similarly to nationally, the majority (90.3%) of these were ‘micro’ enterprises employing 9 or fewer employees whilst 8.1% were ‘small’ (employing 10 to 49 people), and 1.2% were ‘medium’ size enterprises employing 50 to 249 employees. Enterprises classified as ‘large’ (employing 250 employees or more) accounted for a very small percentage (0.2%).
- In 2022, there were 11,900 local units. Again, similarly to the regional and national picture, 86.8% of local units were categorised as ‘micro’ (employing 9 or less people). The majority of these (85%) had less than five employees.
Business enterprises by industry and legal status
- In terms of number of enterprises, ‘Agriculture, forestry and fishing’ is Herefordshire's largest industry with 2,265 businesses; 21.3% of total businesses in Herefordshire, followed by ‘construction’ (11.8%) and ‘professional, technical activities’ (11.0%). These industries were largely made up of ‘micro’ businesses, where fewer than ten people were employed (Figure 1).
- ‘Agriculture, forestry & fishing’, 'manufacturing' ‘business administration & support services’, and ‘education’ were the only industries to have large any businesses (employing 250 or more people), whilst 'manufacturing' had more medium sized businesses (50-249 employees) than any other sector.
- The industries that represented the least number of businesses in Herefordshire were ‘mining, quarrying and utilities’, ‘public administration and defence’ and 'financial and insurance' (together accounting for only 2.9% of all businesses).
Figure 1: Proportion of businesses (enterprises) in Herefordshire by employment size band and industry 2022
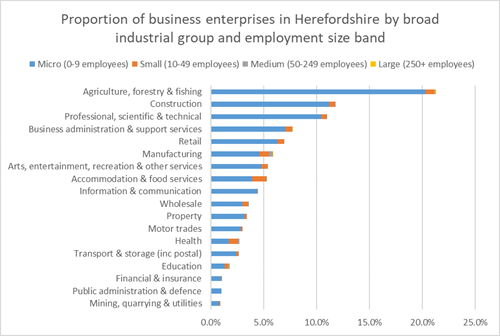
Source: Office for National Statistics
- As might be expected, private sector organisations accounted for the majority of enterprises in Herefordshire (98.8%). A higher proportion of public sector organisations were classed as 'medium' or 'large' than in private sector (see figure 2 below).
Figure 2: Private and public sector enterprises in Herefordshire by size band
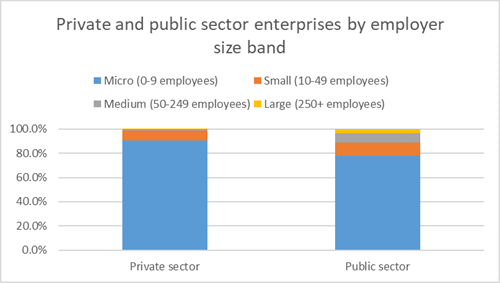
Source: Office for National Statistics
Business demography – Births, deaths and survival of businesses in Herefordshire
The information of formation (birth) and closure (death) of businesses as well as the survival rate is important to get a clear picture about the changing business environment in the local economy. The following statistics are based on the registration of businesses on the VAT (Value Added Tax) and PAYE (Pay As You Earn) tax schemes.
According to the latest data, in 2022:
- Around 9,070 businesses were active in Herefordshire while new business registrations (820) marginally outnumbered the number of deaths (810). Overall, the year on year growth in the number of active businesses has been positive for the last ten years.
- Herefordshire’s new business registration rate was 52 (the rate of business registrations per 10,000 resident population aged 16 and above) which is lower compared to in the West Midlands region (60) and in England (65).
Business Birth and Death rates, the percentage of registrations and de-registrations (respectively), compared to the number of active enterprises indicates the degree of business churn (turnover of businesses) in an area. Higher business churn up to a certain limit can be favourable for economic growth as more productive innovative businesses displace less efficient businesses.
- Herefordshire’s business churn is generally lower than across England and the West Midlands region.
Figure 1: Rate of births and deaths as a proportion of active businesses since 2008.
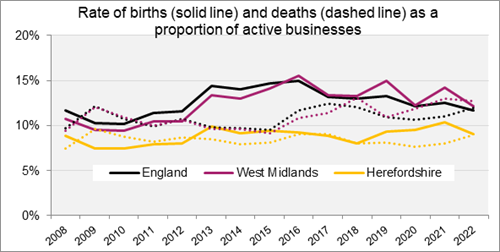
Source: ONS, Business Demography UK
Survival rates of businesses are seen as an important indicator of the quality of new firms starting up in an area and of the strength of the business environment itself. Business survival data include the date of businesses registrations, and provide the percentage of businesses surviving after a certain number of years. These data suggest that businesses locally and nationally are at most risk of closure when they are between 2 and 3 years old. This is especially the case for independent businesses.
- In 2022, 920 new businesses started up in Herefordshire, a rate of 9% (start-ups as a percentage of all active businesses). This was lower than in the West Midlands and nationally (12%). Start-ups are surviving longer in Herefordshire than regionally and nationally (95% at one year for businesses started in 2021; 66% at three years for businesses started in 2018 and 53% at five years for businesses started in 2016. The respective rates for the West Midlands regions were 92%, 45% and 35% and for England were 94%, 56% and 39%. Herefordshire has a greater number of businesses per head of population (575 per 10,000 per population aged 16+) than across the West Midlands (492) and England (560).
High growth enterprises in Herefordshire accounts for 0.3% of total businesses, broadly similar to the national (0.4%) and regional level (0.3%). According to ONS, high growth businesses drive economic growth in the UK. Predicting if a business has the potential to show high growth – or alternatively low performance – could be used to target where and how much people invest, where people choose to work and what support structures and policies are developed and put in place [2].
[1] The rate is the proportion trading after one year.
[2] Understanding the characteristics of high growth companies using non-traditional data sources: https://datasciencecampus.ons.gov.uk/projects/understanding-the-characteristics-of-high-growth-companies-using-non-traditional-data-sources/#:~:text=High%20growth%20businesses%20drive%20economic,developed%20and%20put%20in%20place